

5 Debugging

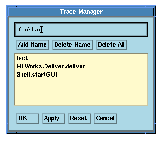
Figure 5.6 The MLWorks trace manager.
A trace of a function listed in the trace manager proceeds as follows: whenever the function is called, MLWorks reports that it has been called, and also reports the result of the call when the function returns.
If you now add efact to the trace manager and type efact 6 in the listener, MLWorks will trace all the recursive calls to efact:
MLWorks> efact 6;
efact 6
	efact 4
		efact 2
			efact 0
			efact returns 1
		efact returns 2
	efact returns 24
efact returns 720
val it : int = 720


Generated with Harlequin WebMaker