


6 Profiling
Shell.Profile.profile function.
We shall use the function pyramid, defined in terms of several other functions, in our examples:
local
  fun a 0 l = l
    | a x l = a (x-1) (x::l);
  fun len (n,[]) = n
    | len (n,x::xs) = len(n+1, xs);
  fun addlens (a,[]) = a
    | addlens (a,x::xs) = addlens(a+len (0,x), xs);
  fun p (0,l) = l
    | p (n,l) = p(n-1,a n l);
  fun b (0,l) = addlens (0,l)
    | b (n,l) = b(n-1,p(n,[])::l);
in
  fun pyramid n = b (n, []);
end
These functions, written in order to demonstrate the profiler, exhibit a range of execution time and allocation characteristics. The pyramid function computates three-dimensional triangular numbers.
Below is shown the result of profiling pyramid 200 with the definitions above in force. Note that exact figures will vary from machine to machine, and from one evaluation to another, so if you profile this function call yourself you should not expect to see identical results.
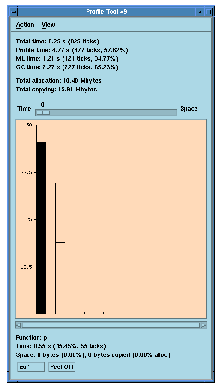
Figure 6.1 The MLWorks profile tool.
At the top of the profile tool you can read the overall profile of the evaluation. At the very top is printed the total CPU time taken by the evaluation, in seconds. This total includes the number of ticks that occurred; the CPU time for each function called in the evaluation is measured by interrupting evaluation every tick (10 milliseconds) and identifying the top function on the stack. (You can change the tick rate if you use the built-in MLWorks.Profile.profile or Shell.Profile.profileFull functions.)
Beneath the total time is the profile time. This is the amount of CPU time during the evalation that was taken by the larger-scale profiling operations.
Beneath the profile time are the total ML and garbage collection (GC) times. These totals show what amounts of the total time (after profile time has been subtracted) were taken up by execution of the ML code itself and by garbage collection. ML time includes some of the profiler operations done at a very fine granularity which are not timed separately.
Beneath ML and GC time you can read the total amount of space allocated by the evaluation. Beneath that, the total amount of that space that was copied by the garbage collector during evaluation is shown. This latter value is therefore a measure of how much work the garbage collector did.
"Total copying" is also a measure of the ephemerality of the allocated data; if a program allocates 9000K but only 180K is copied, then we can conclude that the rest (8820K) died before the program reached a garbage collection point. However, note that the garbage collector will look at long-lived data more than once, so it is possible for "Total copying" to exceed "Total allocation".
Beneath the overall profile is a graph pane. Each bar represents a function, and the height of the bar corresponds by default to how much processor time that function used. The vertical axis is calibrated in percent of total time taken. The Time / Space slider above the graph can turn this into a weighted average of the time and allocation factors. Selecting a bar gives the figures for the function it represents below the graph. Note the following points:
a. It is a curried function, that is it takes two arguments, and MLWorks measures separately time taken in applications to the first argument and to the second argument.
wrapper and <Setup>. These are internal MLWorks functions and can be ignored. They generally have negligible cost, both in time and space.
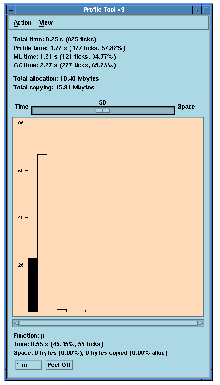
Figure 6.2 A profile with equal weighting of allocation and time.
If choose Action> Sort, the profile tool sorts the bars in decreasing order of size. Figure 6.3 shows what Figure 6.2 looks like after sorting.
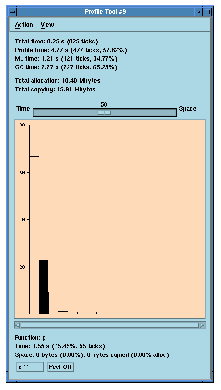
Figure 6.3 The profile graph after being sorted.
When you use the profile tool, the results will appear in the same window each time, replacing the previous profile information. However you can take a "snapshot" of the profile tool at any point with the Action > Duplicate menu item.
Additionally, with the Peel Off button, you can create a dialog containing a text copy of the profile for the function currently selected.
Both the profile tool and the function profile dialog have an Edit button which allow you to edit the source code for the current function in your preferred editor.
Generated with Harlequin WebMaker