


5 Debugging
5.4 Adding breakpoints
Sometimes, when tracking down a bug, you might want to be able to stop a computation whenever a particular function is called. The trace and breakpoint manager is for just this purpose. It is invoked from the menu bar with Tools > Break / Trace.
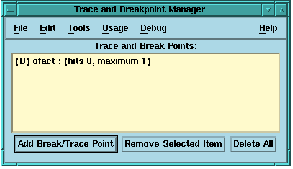
Figure 5.4 The MLWorks breakpoint manager.
The breakpoint manager allows you to specify a number of function names. Whenever one of these function names is called, MLWorks enters the stack browser. To specify a break point, click on Add Break/Trace Point and type the function name into the Name text box and click OK or Apply. The function must have been compiled in debug mode for the breakpoint to take effect.