 XMPI - A Run/Debug GUI for MPI
XMPI
is an X/Motif based graphical user interface for running, debugging and
visualizing MPI programs.
Extensive MPI information is extracted from a running application on demand,
or from a cummulative log of communication.
Both sources are tightly integrated with an application overview window
and any number of single process focus windows.
XMPI is an excellent console for teaching MPI because students can
vividly see the results of message-passing functions.
Key Features

- runtime snapshot of MPI process synchronization
- runtime snapshot of unreceived message synchronization
- single process focus detailing communicator, tag, message length and
datatype
- runtime and post-mortem execution tracing with timeline and
cummulative visualizations
- highly integrated snapshot from communication trace timeline
- process group and datatype type map displays
- assembles MPI applications from local or remote programs
- easy startup and takedown of applications
Application Overview
After interacting with XMPI to run an MPI application, a honeycomb
representation of all processes is displayed in the main (overview) window.
Icons inside each cell indicate the execution state of the process
and alert the user to any unreceived messages.
Processes are identified by their rank in MPI_COMM_WORLD.
A button click updates the information across the entire application
- while the application is running (or perhaps deadlocked or otherwise hung).
This simple capability to inspect, at runtime, the synchronization state
of processes and messages is a very effective debugging tool.
Source code steppers and "printf" are often used to get at the same
information, but in a more cumbersome manner.
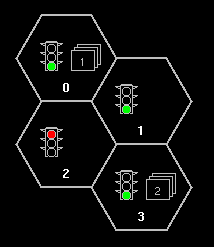
Application Overview: processes and messages
at a glance
Process Focus
A process window with full MPI details on a single process and its unreceived
messages is popped up by a mouse click on an interesting cell in the
application overview.
The key MPI communcation parameters are displayed: communicator, source
rank, destination rank, and element count.
For the datatype, a button pops up a description of the type map.
For the communicator, a button highlights the group membership in the
overview window.
Several process windows may be on the screen simultaneously so
that the user can focus on problem interactions between a few processes.
As with the overview window, all of the process windows are updated
when a new snapshot is taken.
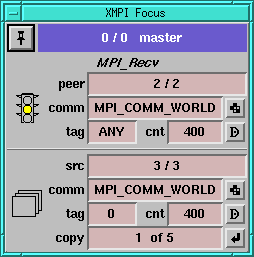
Process Focus: details on process status
and its unreceived messages
 The datatype button displays
the type map.
 The next button shows
the next group of identical messages.
 The group button highlights
the members of the communicator's process group.
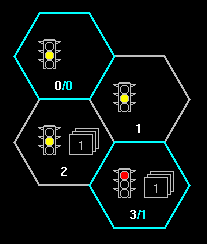
Communication Trace Visualization
XMPI can cause the communication activity of an application to be traced.
The resulting trace data can be extracted at runtime or after the
application completes.
The trace data is visualized in two tried and true ways: the
communication timeline and the kiviat radial chart.
Within XMPI however, these common views are highly intergrated into
the overall debugging picture.
Using a dial in the timeline window, a snapshot of the application
state can be taken as if the same snapshot was taken at
the selected time during the application's run.
The results are displayed in the same manner, using the overview window
and the processes windows.
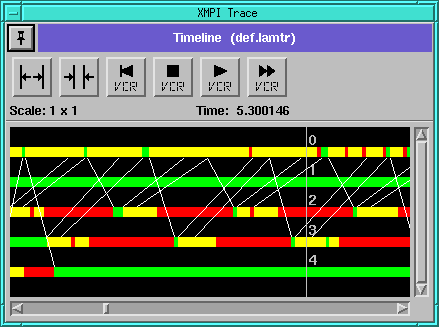
Communication Timeline: Placing the dial
gives a full snapshot of MPI details.
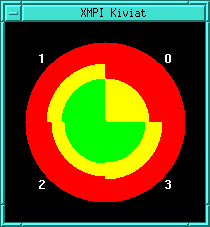
Kiviat: Process states are cummulative
from the start to the dial time.
How to Get XMPI
XMPI was developed at the Ohio Supercomputer Center and is
freely available under a GNU license from the
LAM ftp site.
XMPI can examine pre-existing trace files without running LAM.
Due to the symmetry and integration described above, a fairly full
impression of the tool can be gained in this manner.
Binary executables are available for quick evaluation.
XMPI is supported on the following systems.
- Sun, SunOS 4.1.3, 5.4
- SGI, IRIX 5.3, 6.1
- IBM, AIX version 3, release 2
- DEC, OSF/1 V3.2
- HP, HP-UX 10.01
 LAM / MPI Parallel Computing
/ Ohio Supercomputer Center / lam@tbag.osc.edu


 The datatype button displays
the type map.
 The next button shows
the next group of identical messages.
 The group button highlights
the members of the communicator's process group.


 LAM / MPI Parallel Computing
/ Ohio Supercomputer Center / lam@tbag.osc.edu