The PEPA Plug-in Project

The PEPA Plug-in Project |
|
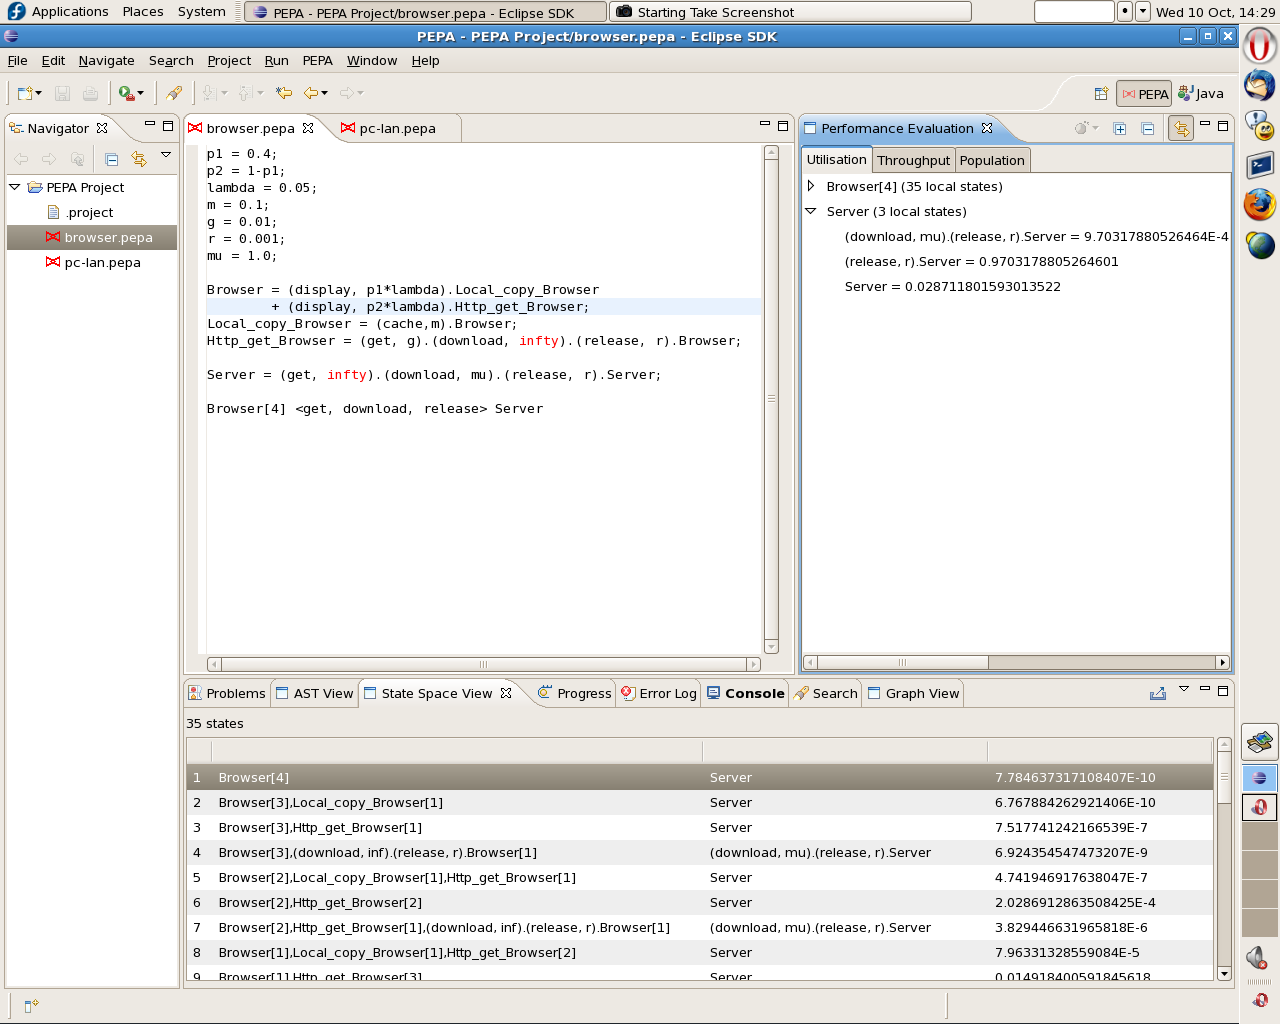
Screenshot showing a PEPA model with a small part of its state
space below (with computed steady states) and utilisation
statistics to the left of the model. Click on the picture for
a larger view.
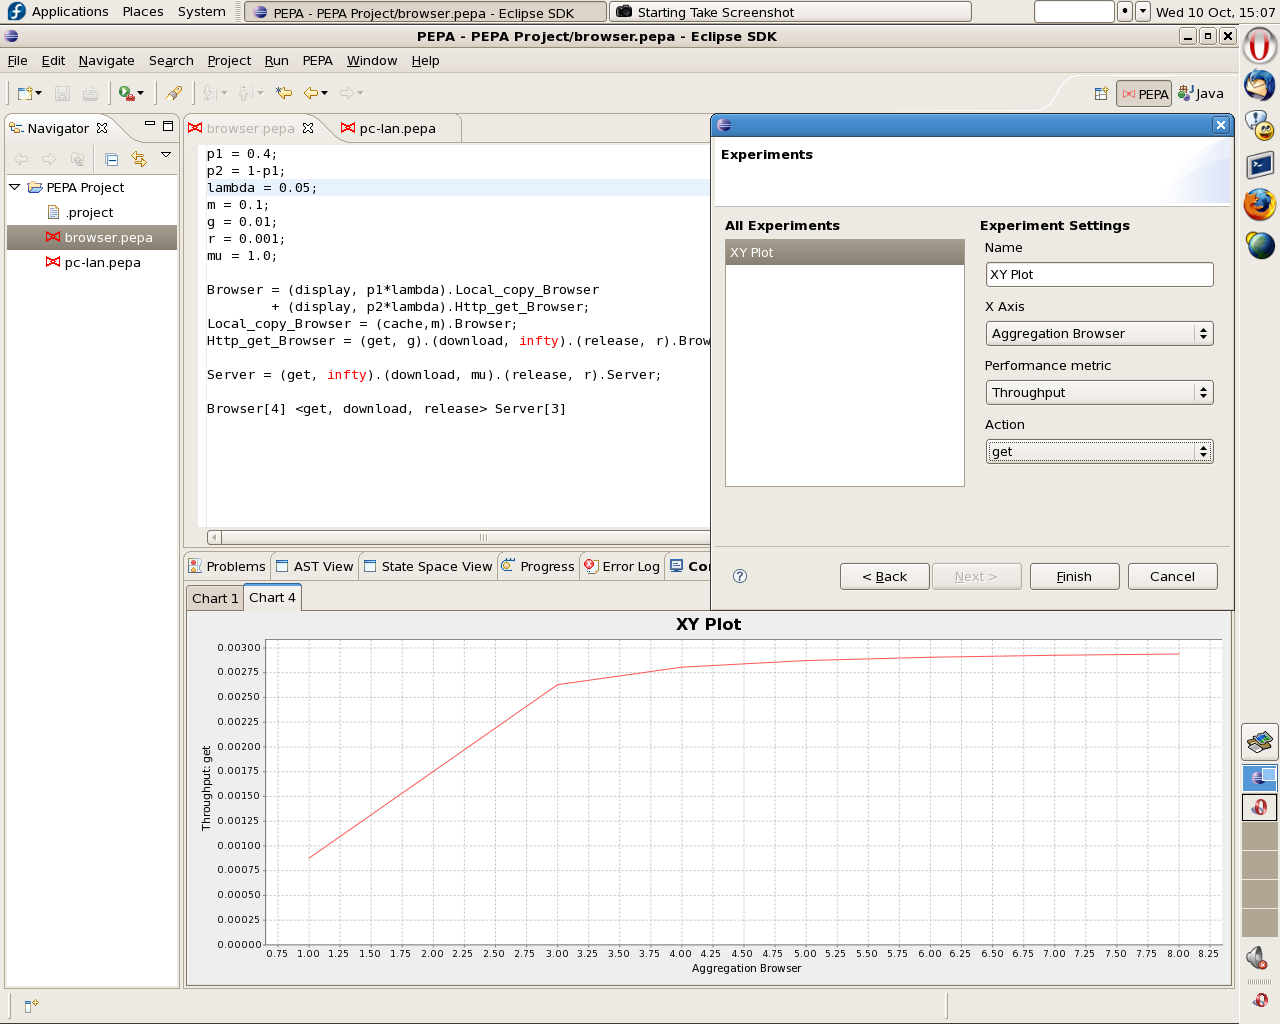
Screenshot showing the same PEPA model with experimentation
wizard. Here the results on throughput when varying the number of Browsers in
the model can be seen from the graph, with the wizard to the
left of the model. Click on the picture for
a larger view.
Screenshot showing behaviour of the model over the first 100
time units. The wizard for time series analysis is to the left
of the model, showing the screen for selecting components. Click on the picture for a larger view.

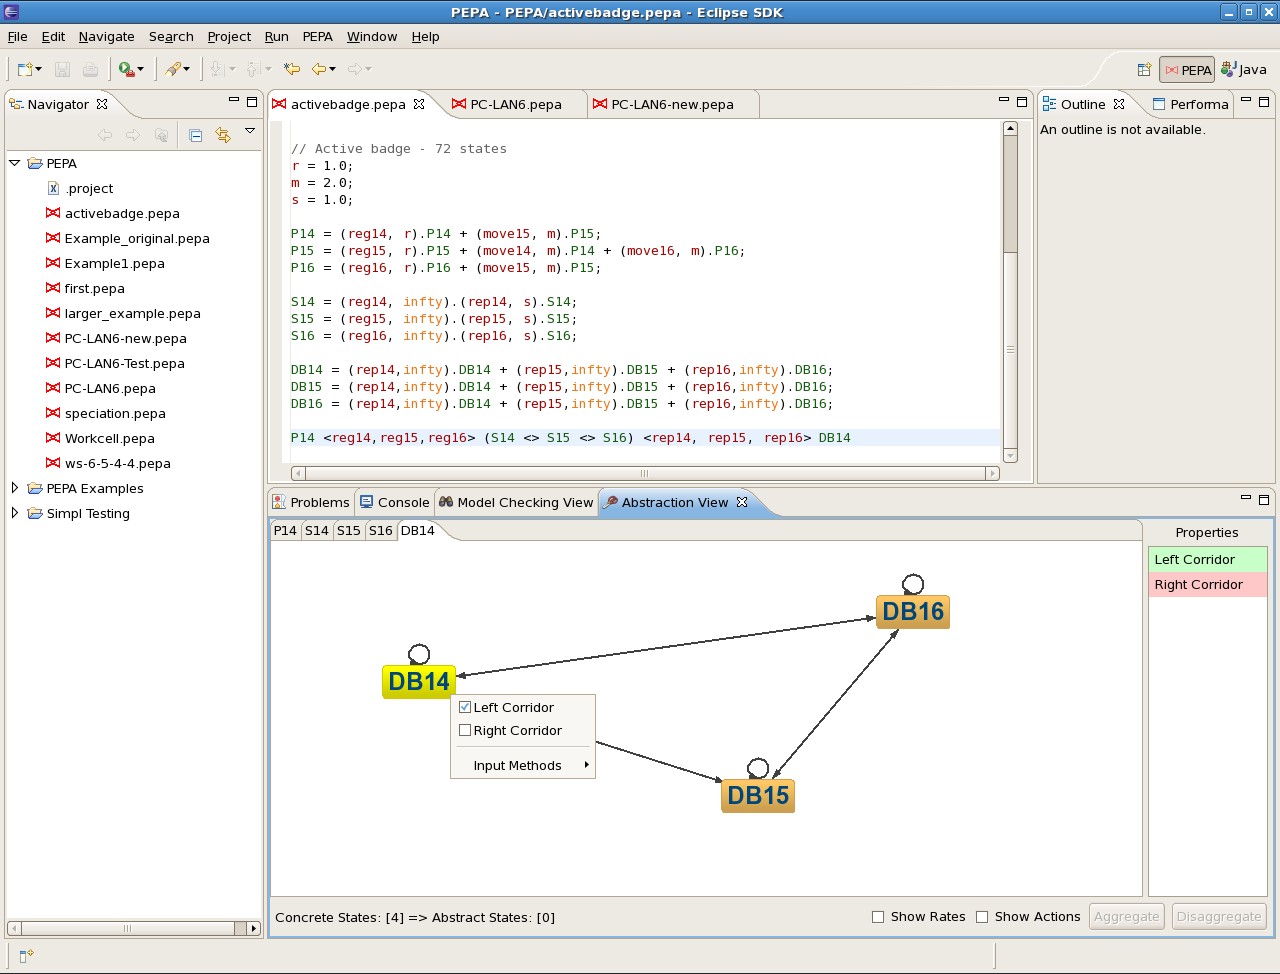
Screenshot showing the abstraction view in use. This displays the sequential components of a PEPA
model in a graphical form, and allows sets of states to be labelled with property names that can
be referred to in the model checking view. A component can be abstracted by selecting a set of states,
and clicking the Aggregate button. Click on the picture for a larger view.
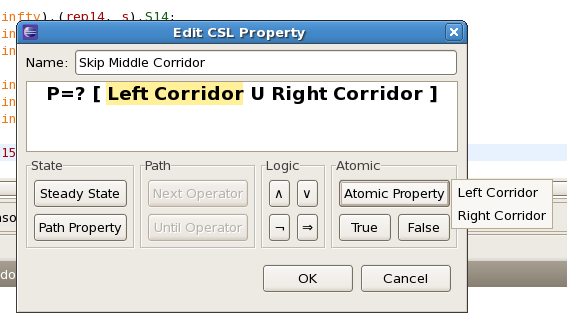
Screenshot showing the editor for Continuous Stochastic Logic (CSL) properties. It only allows valid properties
to be constructed, and allows the atomic properties defined in the abstraction view to be used.
Click on the picture for a larger view.