


Data Visualization |
5 |
 |
This chapter contains the following sections:
Basic Concepts
Data visualization can be used during debugging to help you explore and comprehend large and complex datasets, simulate results, or interactively steer computations. The Data Graph window gives you the ability to "see" program data and analyze that data graphically. The graphs can be printed out or printed to a file.
Specifying Proper Array Expressions
To display your data you must specify the array, and how it should be displayed. You can invoke the Data Graph window from the WorkShop Debugging window by typing an array name in the Expression text box. All scalar array types are supported except for complex (Fortran) array types.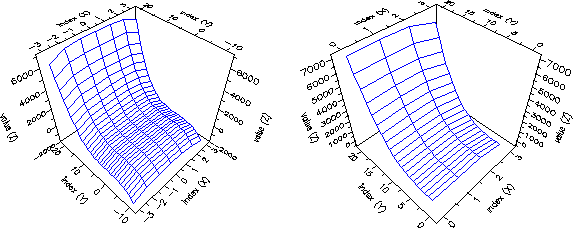
Figure 5-1 Graph of (left)
bf array name only, (right) bf(0:3,1:20)
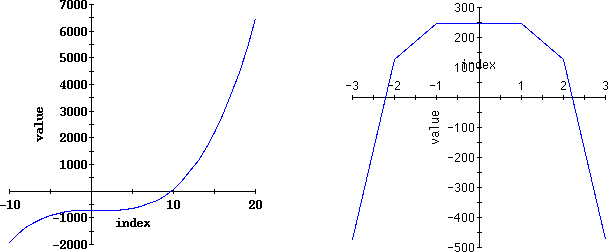
Figure 5-2 Graph of array bf: (left) bf(-3:3,:), (right) bf(:,-7:7)
Graphing an Array
Before you can graph an array, you need to follow these preliminary steps:
 New Program to load your program. If the program was previously loaded in the current WorkShop session, choose the program from the program list in the Debug menu.
From the Debugging window--you can enter an array in the Expression text field and choose Data
 Graph Expression or you can select an array in a text editor and choose Data
  Graph Selected in the Debugging window.
From the Data Display window--you can choose the Graph command from the Data menu or from the identical pop-up menu (right-click to open the pop-up). If the array in the Data Display window can be graphed, the Graph command is active.
From the Data Graph window--you can choose Graph
 New, enter an array name in the Expression text field in the Data Graph: New window and click Graph.
If you click the Replace current graph button, the new graph is replaces the current one. Otherwise, a new Data Graph window is opened.
From the Dbx Commands window--you can display a Data Grapher directly from the dbx command line with the vitem command (you must have opened the Dbx Commands window from WorkShop):
(dbx) vitem -new array-expr |
array-expr specifies the array expression to be displayed. Additional options and arguments for the vitem command can be found in the manual, WorkShop: Command Line Utilities.
Automatic Updating of Array Displays
The value of an array expression can change as the program runs. You can choose whether to show the array expression's new values at specific points within the program or at fixed time intervals with the Update at field in the graph options. Default Options and change the time interval in the Debugging Options dialog box (make sure you are in the Data Grapher category).
Since the timer is also used in collecting data and when checking for memory leaks and access checking, you cannot use the Update at Fixed time interval setting when you are running the Behavior Data Collector or the run-time checking feature.
Note - Every time the timer reaches the nth period, WorkShop tries to update the graph display; however, the array could be out of scope at that particular time and no update can be made.
Changing Your Display
Once your data is graphically displayed, you can adjust and customize the display using the controls in the Data Graph window. This section presents examples of some of graph displays that you can examine.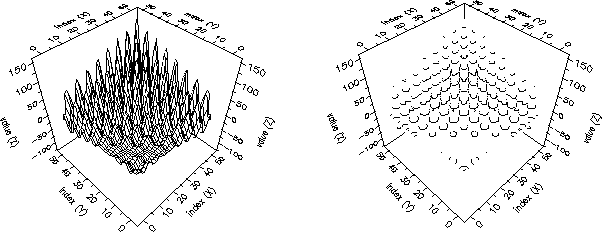
Figure 5-3 Surface graph with (left to right) Wire Mesh, Range Lines
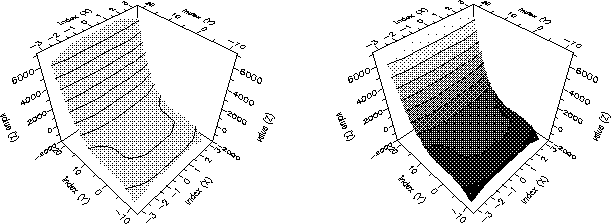
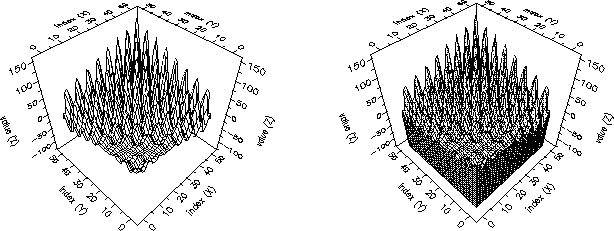
Figure 5-4 Contour graph with (left to right) Range Lines, Range Colors, Both
Figure 5-5 Number of steps (left to right): 5, 10, 15
Analyzing Data
There are different ways to update the data being visualized, depending on what you are trying to accomplish. For example, you can update upon demand, at breakpoints, or at specified time intervals. You can observe changes or analyze final results. This section provides several scenarios illustrating different situations. Scenario 1: Comparing Different Views of the Same Data
The same data can be graphed multiple times which allows different graph types and different segments of data to be compared.
 Graph Expression, which brings up a Surface graph of both dimensions of the bf array.
 Graph Expressions again to bring up a duplicate graph.
 Graph Expression.


