Previous Next Contents Index Doc Set Home


Analyzing Threads

4


Thread Analyzer is a tool for viewing trace information. It displays gprof and prof tables on a per-thread basis.

This chapter describes what you need to do to prepare your program for analysis, how to navigate the Thread Analyzer glyph hierarchy, and how to use Thread Analyzer's menu-driven interface.

Basic Concepts

page 42

Compiling and Instrumenting the Source

page 43

Running an Experiment

page 44

Starting Thread Analyzer

page 44

Exiting Thread Analyzer

page 46

Loading a Trace Directory

page 46

Navigating the Thread Analyzer Glyph Hierarchy

page 47

Thread Analyzer Menus

page 48

Thread Analyzer Usage Scenarios

page 53


Warning - If you are using C++ to create shared libraries, then you need to be careful not to use -Ztha on source files containing static constructors. These constructors will end up trying to record data before the data collection code has been initialized, causing your program to seg fault. Unfortunately, the most common thing that creates static constructors is including <stream.h>.


Basic Concepts

Thread Analyzer displays standard profiling information for each thread in your program, as well as metrics specific to a particular thread such as Mutex wait time and semaphore wait time.

Thread Analyzer displays:

Metrics Collected by Thread Analyzer

Metrics apply to objects. An object can be the entire program, a single thread, or a single function. If a metric refers to a single function, it refers to the total number of times that function was called by a particular thread. Function calls are implicitly divided up according to the thread that made the call.


Note - Thread Analyzer does not support metrics for forked programs.
Table 4-1 briefly describes each metric collected by Thread Analyzer.

Table  4-1 Metrics Collected by Thread Analyzer  

Metric
Description

CPU Time

Measures the amount of time an object was scheduled by the operating system and was running on a CPU.

Wall Clock Time

Measures the amount of time between when an object was created and when it was destroyed. The obvious difference from CPU time is that when a thread is suspended (for instance, waiting for a mutex), the thread still exists even though it isn't taking up CPU time.

Mutex Wait Time

Measures the wall-clock time an object spends suspended waiting to acquire a mutex lock.

Join Wait Time

Measures the wall-clock time an object spends suspended in the thr_join function waiting for another thread to terminate.

Semaphore Wait Time

Measures the wall-clock time an object spends suspended waiting to acquire a semaphore.

Condition Variable Wait Time

Measures the wall-clock time an object spends suspended waiting to be signaled on a condition variable.

RW Read Lock Wait

Measures the wall-clock time an object spends suspended waiting to acquire a read lock on a Reader/Writer style lock.

RW Write Lock Wait

Measures the wall-clock time an object spends suspended waiting to acquire a write lock on a Reader/Writer style lock.

Total Sync Wait Time

Measures the total wall-clock time spent waiting on any of the six forms of threads synchronization.

Read Wait Time

Measures the amount of time spent blocked on read system calls.

File Write (bytes)

Measures the number of bytes written per second by write system calls.

File Writes (ops)

Measures the number of write system calls made per second by a certain object.

File Reads (bytes)

Measures the number of bytes read per second by read system calls.

File Reads (ops)

Measures the number of read system calls made per second by a certain object.

File IO (bytes)

Measures the number of bytes read or written per second by an object via the read and write system calls.

File IO (ops)

Measures the combined number of read and write system calls made by an object per second.


Compiling and Instrumenting the Source

Compile your program with the -Ztha option. This option instruments your program; that is, it inserts instrumentation points at the beginning and end of each function.


Note - If you execute an instrumented program that calls fork, the forked process does not contribute trace data until it calls exec.
The -Ztha option instruments C++ and Fortran programs as well as C programs. The C syntax looks like this:

% cc -Ztha -o prog1 prog1.c


Note - Do not use -Ztha on files containing definitions of the C++ generic "new" operator, signal handlers, malloc, or free.


Running an Experiment

Run the executable file to write trace data to files in a tha.pid directory, where pid is the unique process id of the particular invocation of the object.


Caution - Do not use Control-C to stop a running instrumented program. Control-C can leave the trace directory in an inconsistent state. A subsequent invocation of Thread Analyzer on that trace directory might not process its trace data.


Starting Thread Analyzer

To analyze the trace data collected for your program, start Thread Analyzer from the command line:

% tha &

Optionally, you can direct Thread Analyzer to load a tha.pid trace data directory from the command line.


Note - Thread Analyzer expects to find the executable in the same directory as the trace directory. There are known problems related to correctly finding the executable associated with a trace directory. If you encounter problems in this area, use the -exec command-line option to specify the path name to the executable.
You can use Thread Analyzer's -exec option, in conjunction with the SunOS ls command, to specify a relative path name or full path name to the executable to be used in conjunction with a particular trace data directory.

The following examples show two variations of specifying a full path name for the executable. In each case, tha.1234 is the directory containing the trace information files.

% tha -exec /bin/ls tha.1234 &

is equivalent to

% tha tha.1234 -exec /bin/ls &

The following example shows how to specify a relative path name:

% tha -exec ls tha.1234 &

Figure 4-1 shows Thread Analyzer's main window:


 Click for closeup view.

Figure  4-1 Thread Analyzer Main Window
This window displays a hierarchy of glyphs representing the threads and functions that make up a program. The glyph hierarchy is described in "Navigating the Thread Analyzer Glyph Hierarchy" on page 47.

The Load button loads a trace directory. The View menu allows you to choose the metric you are interested in and whether to display the information as a table or graph. For more information see "Load Button" and "View Button" on page 49.


Exiting Thread Analyzer

From the Window Manager, select Quit to exit the Thread Analyzer session.


Loading a Trace Directory

If you did not specify the tha.pid trace data file in the command line, use the Load button to display a window, shown in Figure 4-2, where you can specify the path to your trace data directory.
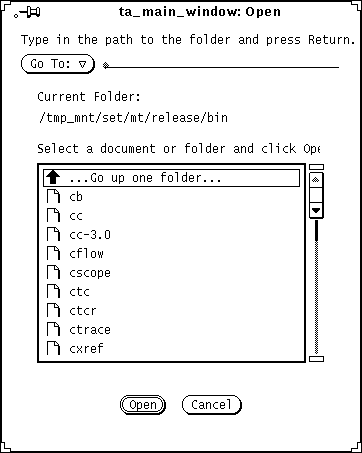
Figure  4-2 Thread Analyzer Load File Window

Note - If you load a trace file with the command line, Thread Analyzer makes the Load button unavailable; that is, Thread Analyzer loads only one trace directory per session.
Type the path name of the trace directory generated by the instrumented program, or click the icon of the desired trace directory in the displayed list. Then click Open. If Thread Analyzer does not recognize the path name you type, check for typographic errors and retype the path name.


Navigating the Thread Analyzer Glyph Hierarchy

Thread Analyzer glyphs are ordered as shown in Figure 4-3.


 Click for closeup view.

Figure  4-3 The Thread Analyzer Glyph Hierarchy
The program glyph is the root of the hierarchy.

The thread level is next in the hierarchy. All threads are displayed across the width of the main window. To see obscured threads, move the slider along the horizontal scrollbar located at the bottom of the window. (See Figure 4-4.)

The function level is the bottom of the tree. Thread Analyzer displays the function (thread children) glyphs in alphabetical order, from left to right. The children of a given thread are the procedures called within that thread. Use the scrollbar to scan function glyphs hidden from view (see Figure 4-4).

Figure  4-4 Scrollbar and Footer Help
To select a particular glyph, place the pointer over that glyph and click the SELECT mouse button. The selected glyph becomes highlighted.

To expand the glyph hierarchy (that is, show a node's children) or collapse the glyph hierarchy (that is, hide a node's children), place the pointer over the desired glyph and click the MENU mouse button. The MENU mouse button acts as a toggle to alternate between expand and collapse.

To hide an individual node, place the pointer over the desired glyph and click the ADJUST mouse button.

As shown in Figure 4-4, Thread Analyzer displays error messages in the footer of the main canvas.

The thread that contains main() is named with the program name; all other threads are named numerically in order of creation.


Thread Analyzer Menus

Thread Analyzer uses the following conventions for menus:

The Load and View buttons are the main menu buttons.

Load Button

The Load button allows you to specify the directory that contains the trace data file. See "Loading a Trace Directory" on page 46.

View Button

Use the View menu to specify the particular metric you are interested in and whether you wish to see it as a table or graph. You can apply a CPU time filter to the glyph display to show only those threads or functions that exceed or equal a particular threshold.

To open the View Menu (see Figure 4-5), click the View button. You can also open the menu with the mouse MENU button and use the pushpin to pin the menu to the canvas.

Figure  4-5 Thread Analyzer View Menu

Metric Graph Property Sheet

Graphs plot the value of a metric against wall-clock time.

1. To display the Metric Graph Property Sheet (see Figure 4-6), choose View Graph from the View menu.

2. Click the SELECT mouse button when the cursor is over the checkboxes for the particular metrics you want to graph.

3. Click Apply to generate the graph.

Figure  4-6 Thread Analyzer Metric Graph Property Sheet

Note - Thread Analyzer allows you to display a maximum of ten graphs at a time and emits an audible beep if you attempt to simultaneously display more than the ten-graph maximum.
See "Scenario 2: Identifying Initial Bottlenecks From Graphical Data" on page 60 for an example of how to display CPU time versus wall-clock time.

gprof Table

gprof tables display call-graph profile data in the form of a list of functions called by threads.

To generate a gprof table for a particular level in the hierarchy, select a glyph at that particular level. Then choose View Gprof Table from the View menu.

See page 56 for an example of how to display a gprof table.

prof Table

prof tables display profile data for the program, threads, and functions. The program-level prof table shows the total time for the entire program. The thread-level prof table has an entry for each thread (with a total of all function calls made by the thread). The function-level prof table has an entry for each thread-function combination.

To generate a prof table for a particular level in the hierarchy, select a glyph at that particular level. Then choose View Prof Table from the View menu.

See page 55 for an example of how to display a prof table.

Sorted Metric Profile Table Property Sheet

A sorted metric profile table shows a designated metric for all nodes for a particular glyph level.

To display the sorted metric profile table property sheet, select a glyph from the desired level in the hierarchy. Then choose View Sorted Metric Profile Table from the View menu.
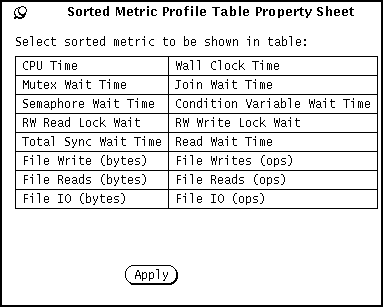
Figure  4-7 Thread Analyzer Sorted Metric Profile Table Property Sheet
Click the SELECT mouse button when the cursor is over the metric you want to graph--you may select only one from this list. Grayed-out entries signify metrics that are not available. Click Apply to generate the table.

See page 59 for an example of how to generate a sorted metric table.

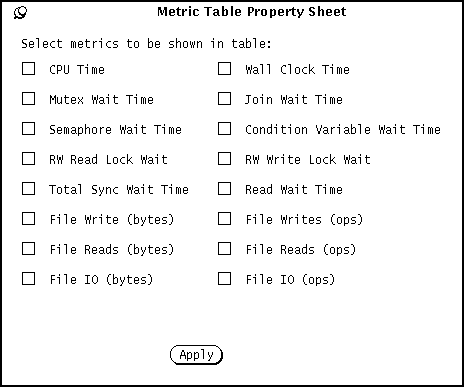
Metric Table

A metric table shows multiple metrics for a particular thread or function. For a function, the metrics are shown for calls of that function made by the thread that is that function's parent.

To display the metric table property sheet, select a glyph from the desired level in the hierarchy. Then choose View Metric Table from the View menu.

Figure  4-8 Thread Analyzer Metric Table Property Sheet
Click the SELECT button when the cursor is over the checkbox for the metrics you want to graph. Then click Apply to generate the table.

See page 58 for an example of how to generate a metric table.

Filter Threads by CPU

The filter shown in Figure 4-9 displays the thread glyphs whose percent of CPU time is equal to or greater than a designated threshold.

Figure  4-9 Thread Analyzer: Filter Threads by CPU Time
Type the threshold value and click Apply.

See page 63 for an example of how to filter threads by CPU time.

Filter Functions by CPU

The filter shown in Figure 4-10 displays the function glyphs whose percent of CPU time is equal to or greater than a designated threshold.

Figure  4-10 Thread Analyzer: Filter Functions by CPU Time
Type the threshold value and click Apply.


Thread Analyzer Usage Scenarios

This section contains scenarios demonstrating the use of Thread Analyzer.

Scenario 1: Initial Investigation --CPU Time Tabular Data

The initial investigation gathers an overview of what your program is doing.

Looking at CPU time is a good starting point to discover where your program is spending its time.

1. Display the thread-level nodes.

If the thread-level nodes are not already displayed, place the cursor over the Program node and click the mouse MENU button to expand the glyph display to the thread-level nodes (see Figure 4-11).


 Click for closeup view.

Figure  4-11 Displaying Thread-Level Nodes

2. Request a prof table for all threads.

Select any thread glyph. Choose View Prof Table from the View menu to display prof information for all the threads in your program (see Figure 4-12).
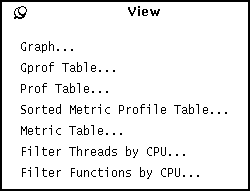
Figure  4-12 prof Information for Threads

3. Analyze the prof table data.

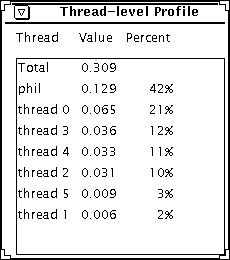
The prof table shows the percent of CPU time spent by all threads of the program. Table elements are arranged in descending order of CPU time.

Figure  4-13 Thread-Level Profile

See if any threads consume a disproportionate amount of CPU time. In Figure 4-13 the phil thread accounts for 42 percent of the CPU time, and is a likely candidate for further investigation.

4. Focus on a particular thread.

Move the cursor to the phil node and click the mouse MENU button; this action causes the children (function nodes) of the phil node to be displayed as shown in Figure 4-14.


 Click for closeup view.

Figure  4-14 Focus on a Particular Thread

5. Request a gprof table for a particular thread.

To generate a gprof table for a particular thread--phil is still selected--choose View Gprof Table from the View menu.

Thread Analyzer displays a thread-specific gprof table for the phil thread, as shown in Figure 4-15. See the gprof(1) manual page for more information.


 Click for closeup view.

Figure  4-15 Thread Analyzer: gprof Table

Note - called+self shows direct recursion; <cycle> shows indirect recursion.

6. Request a metric table for a particular function.

Select the glyph for a particular function. Then choose View Metric Table from the View menu. Click the CPU Time checkbox, then click Apply. You can select multiple metrics from this menu).
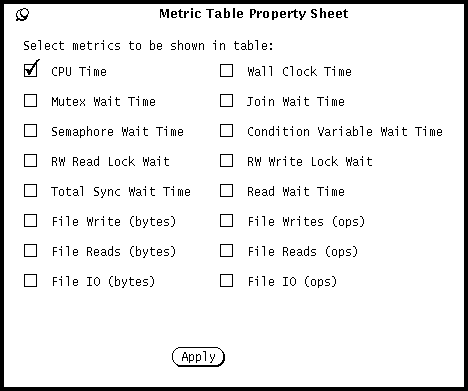
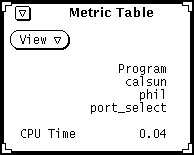
Figure  4-16 Thread Analyzer Metric Table Property Sheet

The resultant table shows the CPU time used by the port_select function in the phil thread.

To display a metric table for a thread, select its glyph in the hierarchy. Repeat the request for a metric table for CPU Time. The resultant table shows the CPU time used by the phil thread

7. Request a sorted metric profile table for all threads.

Thread Analyzer displays a sorted metric profile table for a single metric for all functions in all threads (see Figure 4-17).

Select any function in the glyph hierarchy. Then choose View Sorted Metric Profile Table from the View menu. Select CPU Time in the property sheet, then click Apply.

Figure  4-17 Sorted Metric Profile Table Property Sheet

Thread Analyzer displays CPU time for all functions in all threads. The table is sorted in descending order of percentage of time spent.

Scenario 2: Identifying Initial Bottlenecks From Graphical Data

Thread Analyzer can plot time graphs of the metrics to help discern the performance of your program. In particular, this feature helps discover performance bottlenecks. A common metric to view is the consumption of CPU time versus wall-clock time.

1. Select the node of interest

Select the glyph for the thread to be analyzed. Then choose View Graph from the View menu.

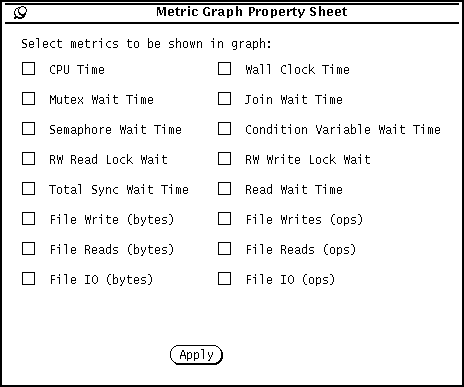
2. Designate the metric

Click the CPU Time checkbox and then click Apply (see Figure 4-18).

Figure  4-18 Metric Graph Property Sheet

Thread Analyzer plots percentage of CPU Time (y axis) versus wall-clock time (x axis) as shown in Figure 4-19.


 Click for closeup view.

Figure  4-19 CPU Time versus Wall-clock Time

Except for a few "spikes," a small amount of CPU time is being consumed. This fact suggests a bottleneck in I/O or thread synchronization (see "Scenario 3: Identifying Focused Bottlenecks From Graphical Data" next).

Scenario 3: Identifying Focused Bottlenecks From Graphical Data

Thread Analyzer graphs can plot the time spent waiting on a resource. Such graphs can help you diagnose performance bottlenecks caused by blocking on I/O or thread synchronization.

1. Select the node of interest

Select the phil glyph in the hierarchy. Then choose View Graph from the View menu.

2. Designate the metric

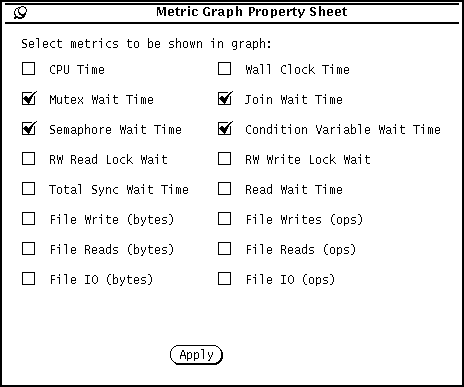
In the metric graph property sheet, click the checkbox for the metrics you wish to graph, then click Apply. In Figure 4-20, the synchronization-related metrics are selected.

Figure  4-20 Metric Graph Property Sheet

Thread Analyzer plots percentage of time waiting for a resource (y axis) versus wall-clock time (x axis). Thread Analyzer shows each metric with a different line representation (see the legend at the bottom of the graph in Figure 4-21).


 Click for closeup view.

Figure  4-21 Percent of Resource-Waiting Time Versus Wall-clock Time

This graph shows that most of the time waiting for a resource was spent in CV (condition variable) wait time.

Scenario 4: CPU Time Filter

The filter threads by CPU operation modifies the glyph display to show only those threads that spend the designated percentage of total CPU time.

1. Display the thread level nodes

Expand the glyph hierarchy to show all threads, as shown in Figure 4-22. Select a thread icon.


 Click for closeup view.

Figure  4-22 Expanded Glyph Hierarchy

2. Specify the Filter Value

Choose View Filter Threads by CPU from the View menu.

Figure  4-23 Filter Functions by CPU

In the box that appears (see Figure 4-23) type the threshold value (8 for our example) and click Apply.

The canvas collapses to show only those threads that account for at least 8 percent of the CPU time of the program run


 Click for closeup view.
(see Figure 4-24).

Figure  4-24 Threads Displayed Above CPU Time Threshold


Previous Next Contents Index Doc Set Home