

1 Using MLWorks interactively
Before using the stack browser, it is important to turn on debugging mode; this will ensure that the necessary debugging information is generated when code is compiled, so that it can later be passed to the stack browser. To turn on debugging mode, choose Preferences > Mode from the podium. In the mode options dialog, select the Debugging check box and click OK.
To invoke the stack browser, you need to raise an unhandled exception. Define and call the following less useful variation on the factorial function:
MLWorks> exception Fract;
exception Fract
MLWorks> fun fract 0 = raise Fract | fract n = n * fract (n-1);
val fract : int -> int = fn
MLWorks> fract 5;
On the call to
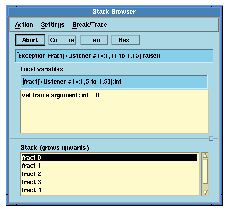
fract 5, MLWorks enters the stack browser.

Figure 1.12 The MLWorks stack browser.
The box at the top contains an error message which tells you what exception was raised, and the bottom window contains a list of the function calls leading up to the unhandled exception. Selecting one of these with the mouse brings up information about that function call in the middle pane of the stack browser.
The Abort button closes the stack browser and returns control to the listener.
For more details of the stack browser, see Chapter 5, "Debugging".


Generated with Harlequin WebMaker