

5 Debugging
debug.sml, containing the following curious code defining factorial functions for odd and even numbers:
exception Fact;
fun ofact 0 = raise Fact | ofact n = n * efact (n-1)
and efact 0 = 1 | efact n = n * ofact (n-1);
Now read this file from a listener with File > Use File.
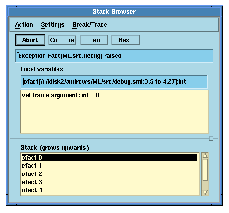
The somewhat inefficiently coded functions efact and ofact happily compute factorials of even and odd integers, respectively. However, invoking one of them on an integer of the wrong parity raises an exception, and enters the stack browser. In the listener window, type
MLWorks> ofact 6;The stack browser appears, with a list of the function calls leading up to the uncaught exception.

Figure 5.1 The MLWorks stack browser.
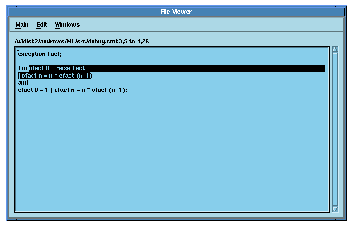
At the same time, a view of the file debug.sml appears in one of two ways:
efact, is highlighted, but you can move about the source and edit it.
efact is highlighted. Choosing Action > Edit from the stack browser puts you into your preferred editor, passing the line number of the definition of efact.

Figure 5.2 The MLWorks file viewer.
In the bottom pane of the stack browser are the function calls leading to the uncaught exception; they are alternately efact and ofact. You can select any function call by clicking. Selecting a function call has two effects:


Generated with Harlequin WebMaker