


4.2 Examining values: the inspector
4.2.1 Changing the graph layout
Different data structures have different shapes, which can affect how best to represent them graphically. Type the following two lines into the listener:
MLWorks> fun ilist 0 = nil | ilist n = n::ilist (n-1);
val ilist : int -> int list = fn
MLWorks> ilist 100;
val it : int list = [ 100, 99, 98, 97, 96, 95, 94, 93, 92, 91, ..]
MLWorks>
Now choose Usage > Inspect and click on the root node to see all the children of this hundred-element list.
The current representation is not, perhaps, the most useful for inspecting this value. Select Usage > Tool Settings > Graph Layout... to get a dialog from which the appearance of the graph can be changed. On this dialog, select:
- Orientation > Vertical
- Line Style > Step
- Child Position > Next
- Horizontal Spacing > 1
Click Apply. The appearance of the graph changes to reflect the new options.
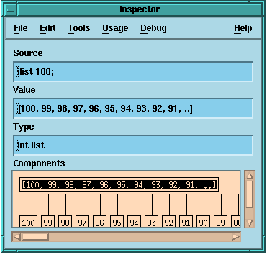
Figure 4.2 The inspector graph after setting changes.
The many parent-child links are easier to distinguish because you have specified steps instead of straight lines. The Child Position setting ensures that the list itself aligns with its first few entries, rather than the entries in the middle, and the decrease in horizontal spacing allows more values to fit in the inspector window.
The Orientation setting affects whether successive generations appear below their parents, or to the right of them. Change this setting to Horizontal, and set Vertical Spacing to zero, to get a tall thin graph instead of a short wide one.
Of course, with sufficiently large structures, no amount of settings will make it possible to view an entire value at one time, but it is generally possible to see the important information by judicious expansion and contraction of parts of the graph. The layout options are present to provide further flexibility.