Previous Next Contents Index Doc Set Home


Analyzing Program Performance

6


This chapter describes how to use the Behavior Data Collector and the Analyzer to performance-tune applications in Sun WorkShop. This chapter is organized into the following sections:

Performance Profiling in WorkShop

page 47

Collecting Performance Data

page 50

Analyzing Performance Data

page 51


Performance Profiling in WorkShop

The Behavior Data Collector, available from the WorkShop Debugging window, gathers performance data during the execution of an application and saves it to an experiment file. The Analyzer, a separate window available from the WorkShop main window, displays collected performance data and, if paging is causing a bottleneck, can create a file to instruct the linker to remap functions in memory.
The UNIX prof and gprof performance profiling tools generate only user CPU information. With the Collector and Analyzer, you can get information about I/O time, system time, text and data page fault times, program sizes, and execution statistics, in addition to user CPU information.

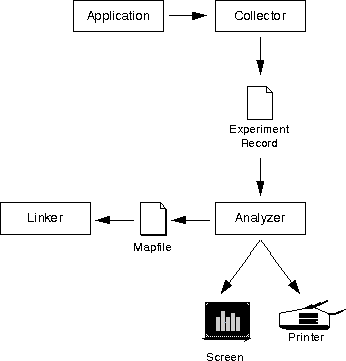
The following figure illustrates the basic performance-tuning architecture in WorkShop:

Figure  6-1 Performance-Tuning Architecture
The Collector gathers performance data from the application and writes it to an experiment record. The Analyzer displays that experiment data online and can print the data to either a file or a printer. Additionally, the Analyzer can create a mapfile for the linker, and you can then recompile the application.

The preceeding table shows the basic steps involved in collecting and analyzing performance data. For more detailed information on any of the steps, see "Analyzing Perofrmance Data" and "Collecting Performance Data" in the online help for the WorkShop.


Table  6-1 Task List: Collecting and Analyzing Performance Data 

Task
Description

Build the application

1. Compile the application. Though not required for performance analysis, the -g compile option gives the Collector more information and yields the most accurate experiment data.

2. Link the application.

Collect performance data

1. From the Debugging window, disable runtime checking and choose Windows Collector to open the Behavior Data Collector.

2. In the Experiment File text field, type the complete path name for the experiment file to be created.

3. Select whether you want to collect data for one run only or for all runs.

4. Load the program into the Debugging window and run it by clicking either Start or Go.

Analyze performance data

1. Open the Analyzer by choosing Collect Analyze from the Behavior Data Collector.

2. Load the experiment file just created.

3. View the performance data in different ways by selecting various data types and display options from the Analyzer window. See "Selecting Data Types" and "Selecting Display Options" in the WorkShop online help for descriptions of the data types and display options.

Reorder the application, if needed

1. Compile the application using the -xF option.

2. Use the Behavior Data Collector to regather performance data for the application.

3. Load the experiment file containing the collected data into the Analyzer.

4. Create a reordered map by choosing Experiment Create Mapfile and typing the samples to be used, the mapfile directory, and the name of the mapfile in the file chooser.

5. Link the application again using the new mapfile.


Collecting Performance Data

The Behavior Data Collector gathers performance data about a program as it runs through the Debugging window. To view the results of the experiment file you collect, you must use the Analyzer window, which is available separately through the WorkShop main window or can be displayed by choosing Collect Analyze from the Collector.

When you create an experiment file in the Collector, you also create a hidden directory. The hidden directory name is preceded by a dot (.)--for example, if the experiment file is called test.1.er, the hidden directory is called .test.1.er. Files in this directory contain information on segments, modules, lines, and functions.

Types of Data You Can Collect

You can collect three types of data:

For more information on choosing the type of data to collect, see "Choosing the Type of Data to Collect" in the Workshop online help.

Frequency of Sample Collection

Samples are sets of data collected over specific periods of time while an application is running.

You can specify the frequency of sample collection by moving the Collect Profile data slider to the desired number of samples per second. Both data accuracy and collection overhead increase as the number of samples collected per second increases.


Analyzing Performance Data

After you collect performance data with the Behavior Data Collector, you can view it only through the Analyzer, a separate window available from the WorkShop main window. The three types of data you can collect with the Behavior Data Collector separate into nine types of data available to analyze; each of these nine types of analyzable data has one or two Analyzer display options associated with it.

Types of Data You Can View and Analyze

You can analyze the following types of data by selecting them from the Data list in the Analyzer window:

For more information on selecting a data type, see "Selecting Data Types" in the WorkShop online help.

Display Options

The Analyzer offers five ways to view collected performance data:

For more information on selecting a display option, see "Selecting Display Options" in the WorkShop online help.

Comparing Samples

By choosing View New Window in an Analyzer window, you can open a new Analyzer window to compare two samples or view the same set of samples in two different ways.

Reordering Program Functions

If text page faults are consuming a lot of your application's time, the Analyzer can reorder your program, generating a mapfile containing an improved ordering of functions. With the most-used functions grouped together on the same set of pages, a function is more likely to already be in memory when called. See the WorkShop online help topic "Reordering an Application" for instructions for reordering an application.

Printing

You can print a plain text version of the current display or a text summary of the experiment (including average sample times for each data type and the frequency of use of functions, modules, and segments) by choosing Experiment Print or Experiment Print Summary in the Analyzer window and typing the appropriate information in the dialog box.

Exporting Experiment Data

You can export collected experiment data to files for use by other programs (such as spreadsheets or custom-written applications) by choosing Experiment Export in the Analyzer window and typing the name and directory of the experiment file to be exported in the Export dialog box.


Previous Next Contents Index Doc Set Home